
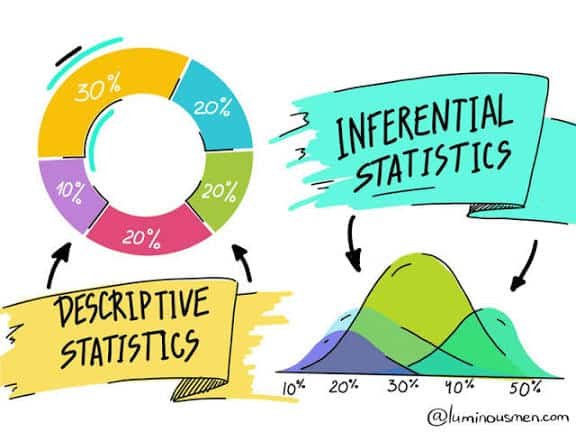
Statistics is the mathematical engine of data science. Every time you explore a dataset, evaluate an A/B test, or train a predictive machine learning model, you rely on statistical principles.
Broadly, statistics is divided into two primary branches: Descriptive Statistics and Inferential Statistics.
While descriptive statistics focuses on summarizing the data you already have, inferential statistics uses that data to draw broader conclusions about a larger population. Here is a comprehensive guide to understanding both branches, their techniques, and how they work together in data science.
1. Descriptive Statistics: Summarizing Known Data
Descriptive statistics involves organizing, summarizing, and presenting data in a clear, meaningful way. It deals exclusively with a known dataset (whether that dataset is a small sample or an entire population).
Descriptive methods do not attempt to reach conclusions beyond the data being analyzed—they simply describe “what is.”
Raw Data ──► Summarize & Clean ──► Tables, Metrics, & Charts (Descriptive)
Core Dimensions of Descriptive Statistics
1. Measures of Central Tendency
These metrics describe the center or typical value of a distribution:
-
Mean: The mathematical average of all data points. (Sensitive to extreme outliers).
-
Median: The middle value in a sorted dataset. (Robust against outliers).
-
Mode: The most frequently occurring value in a dataset.
2. Measures of Dispersion (Variability)
These metrics describe how spread out the data points are relative to the center:
-
Range: The difference between the highest and lowest values ($Max – Min$).
-
Variance ($\sigma^2$): The average squared deviation from the mean.
-
Standard Deviation ($\sigma$): The square root of variance, expressed in the original unit of measurement.
-
Interquartile Range (IQR): The distance between the 25th percentile ($Q_1$) and 75th percentile ($Q_3$).
3. Visual Summaries
-
Histograms & Density Plots: Reveal distribution shape and skewness.
-
Box Plots: Highlight medians, quartiles, and statistical outliers.
-
Bar Charts & Pie Charts: Display frequency counts across categorical groups.
2. Inferential Statistics: Generalizing Beyond Sample Data
Collecting data from an entire population (e.g., every internet user on Earth) is almost always impossible, expensive, or impractical. Instead, data scientists collect a representative sample and use inferential statistics to make estimates, hypotheses, and predictions about the broader population.
Sample Data ──► Apply Probability Models ──► Make Claims About Entire Population (Inferential)
Key Pillars of Inferential Statistics
1. Hypothesis Testing

Hypothesis testing determines whether an observed effect in a sample dataset is statistically significant or merely the result of random chance.
-
Null Hypothesis ($H_0$): Assumes no effect or difference exists.
-
Alternative Hypothesis ($H_1$): Assumes an effect or difference exists.
-
Common Tests: $t$-tests, ANOVA, Chi-Square tests, $Z$-tests.
2. Confidence Intervals
A confidence interval provides a range of plausible values for an unknown population parameter rather than a single point estimate.
-
Example: “Based on our sample survey, we are $95\%$ confident that the true average user response time across all global servers is between $120\text{ ms}$ and $135\text{ ms}$.”
3. Regression Analysis & Forecasting
Modeling relationships between dependent and independent variables to make predictions on unseen population data (e.g., Linear and Logistic Regression).
Direct Comparison: Descriptive vs. Inferential
| Feature | Descriptive Statistics | Inferential Statistics |
| Primary Goal | Summarize and present raw data clearly | Make predictions and draw conclusions about a population |
| Data Scope | Analyzes the exact dataset collected | Extrapolates from a sample to an entire population |
| Output Format | Charts, graphs, tables, summary metrics (Mean, SD) | Probability scores ($p$-value), Confidence Intervals, Test Statistics |
| Uncertainty | Zero (Describes exact observed numbers) | Includes uncertainty (quantified using probability margins) |
| Common Tools | Histograms, Box plots, Mean, Median, Variance | Hypothesis Tests ($t$-test, ANOVA), Regression, Confidence Intervals |
How They Work Together: A Real-World E-Commerce Example
To see how both branches interact in a data science pipeline, imagine an e-commerce platform launching a redesigned checkout button.
       [ Step 1: Descriptive ]                      [ Step 2: Inferential ]
   Calculate sample conversion rates         A/B Hypothesis Test (p-value = 0.01)
 ┌──────────────────────────────────┐       ┌────────────────────────────────────┐
 │ Old Button: 4.2% Conversion Rate │ ───►  │ REDESIGN IS BETTER FOR ALL USERS! │
 │ New Button: 5.8% Conversion Rate │       │ Reject H0 (95% Confidence Level)   │
 └──────────────────────────────────┘       └────────────────────────────────────┘
-
The Descriptive Phase:The team collects sample data from 10,000 visitors over one week.
-
Old Button Conversion Rate: $4.2\%$
-
New Button Conversion Rate: $5.8\%$
-
Descriptive Conclusion: In this specific sample group of 10,000 visitors, the new button produced a $1.6\%$ higher conversion rate.
-
-
The Inferential Phase:The team must decide if they should roll out the button to all 10 million monthly active users.
-
They run a Two-Sample $t$-Test (A/B Test) on the sample data.
-
The resulting $p$-value is $0.01$ ($<0.05$ threshold).
-
Inferential Conclusion: The $1.6\%$ increase was not a random fluke. The team rejects the null hypothesis and confidently rolls out the feature worldwide.
-
Key Takeaway
Descriptive statistics sets the foundation by helping you clean, visualize, and understand your immediate dataset. Inferential statistics takes you across the finish line—allowing you to make reliable, data-backed decisions and predictions that scale to entire populations under uncertainty.